

DP-700 Course guide
DP-700 Exam Guide: Build a Fabric Medallion Platform
What the DP-700 Fabric Data Engineer exam covers, its 3 domains, and a hands-on plan building a medallion platform on NYC taxi data.

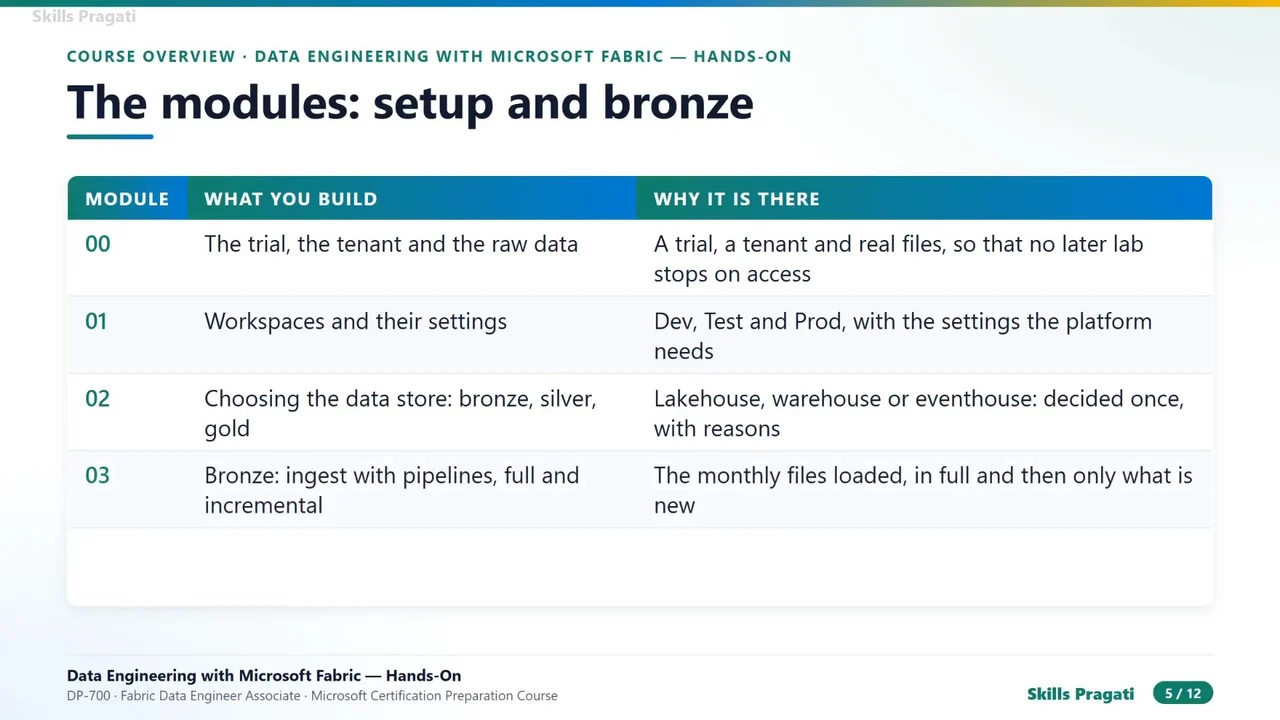
You never run analytics on the operational system. You move the data out and build a separate platform beside it. Building and running that platform is data engineering, and it is what the DP-700 exam, Fabric Data Engineer Associate, measures.
The problem the course solves
New York City publishes every taxi trip in the city: millions of rows a month, as Parquet files. A transport analytics team has three questions: where and when is demand, what does a trip earn, and what did the 2025 congestion charge change? Nobody can answer them from the raw files. The course builds what sits between the files and the answers.
The three exam domains
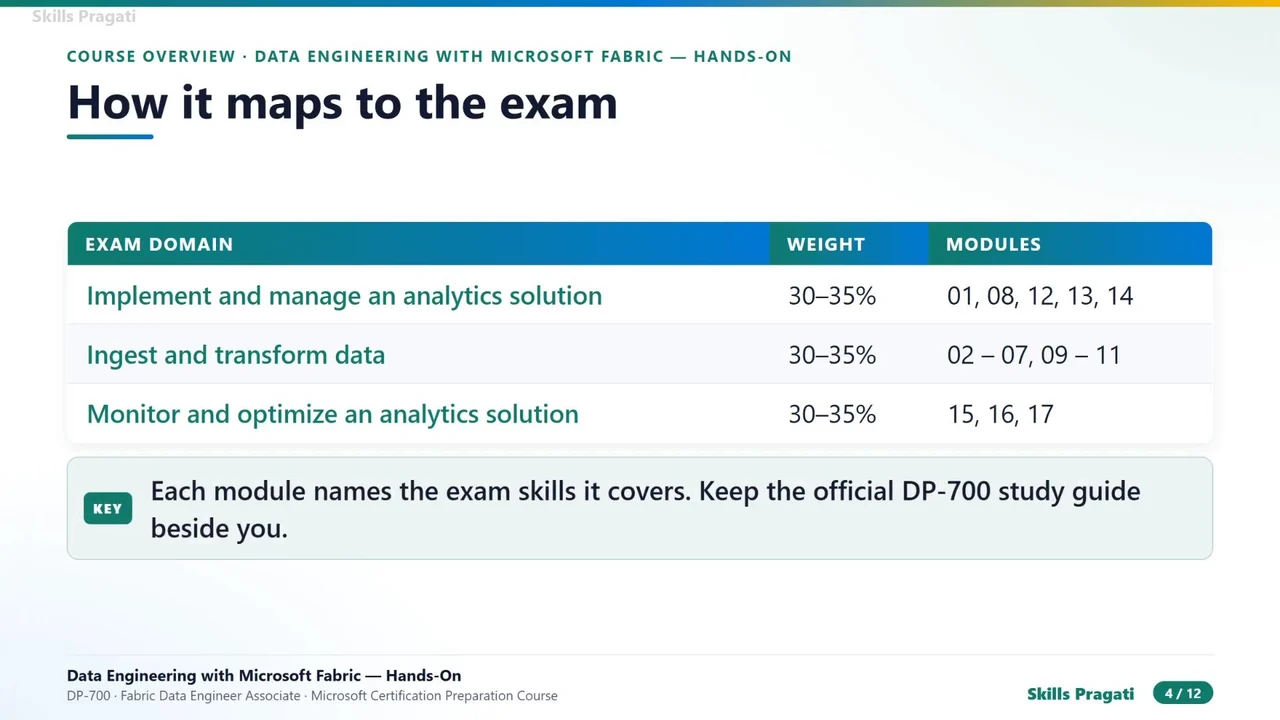
| Domain | Weight | Modules |
|---|---|---|
| Implement and manage an analytics solution | 30–35% | 01, 08, 12, 13, 14 |
| Ingest and transform data | 30–35% | 02–07, 09–11 |
| Monitor and optimize an analytics solution | 30–35% | 15, 16, 17 |
Keep the official DP-700 study guide beside you; each lab names the exam skills it covers.
The five jobs of a data engineer
Ingest, store, transform, serve, and operate: schedule, secure, version, monitor, and make it faster and cheaper. The course is those five things in order, on Microsoft Fabric, with one lake underneath (OneLake, in Delta format) and three languages on the same data: SQL, PySpark and KQL.
The architecture is the medallion: landing (files as published), bronze (raw rows, appended month by month), silver (one clean table), gold (a star schema), and the report on top, with a real-time path beside it.
What you hand over at the end
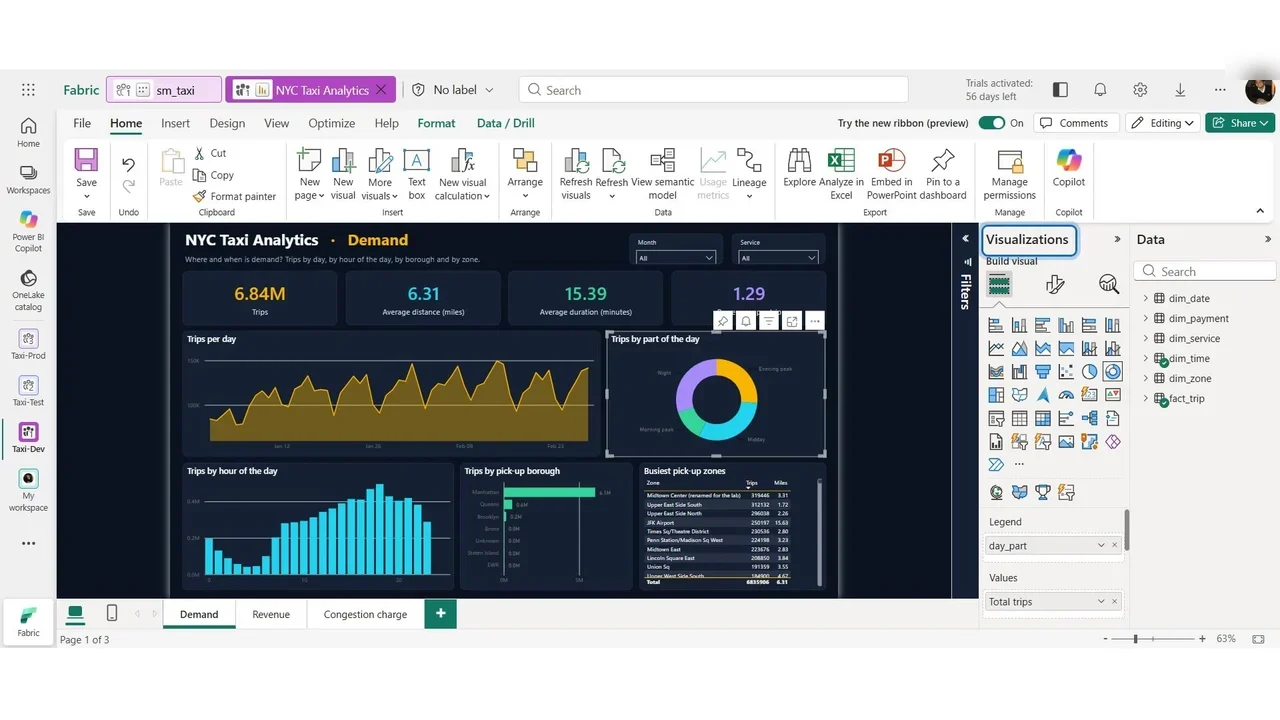
- A report, NYC Taxi Analytics: three pages, one per business question.
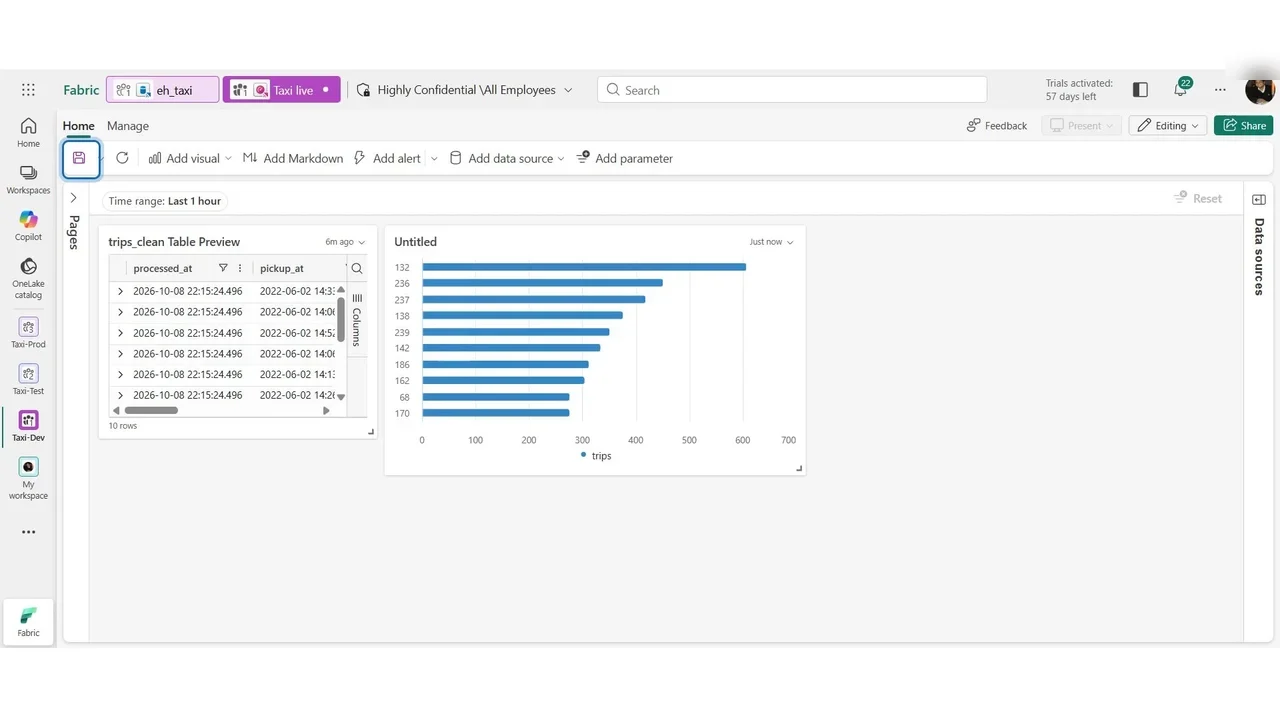
- A real-time dashboard, Taxi live, refreshed every thirty seconds.
- A load that needs no hands: one pipeline ingests the new month, cleans it, models it and refreshes the report.
- Data that is safe to share: row-level and column-level security, masking, sensitivity labels and an audit trail.
- A platform you can rebuild: everything in Git, promoted from development to test to production.
One piece of advice
The exam asks which one, and why far more often than it asks how: which store, which tool, which streaming engine. The theory lessons are where you learn to choose. Do not skip them.
The full course is free on YouTube
The overview above is the first of 42 videos, all done in the browser with nothing to install.
Do it yourself
- The full DP-700 courseEvery Part, free on YouTube, in order
- Hands-on lab guideThe exact steps, what it costs, how to clean up
- Practice simulationRehearse every click in your browser; the first lab is free
- Mock examFree 10-question sample, then the full timed mock scored by domain
Lab guides, practice and full mock exams come with a subscription. See the plans