

DP-700 Step by step · Module 18
Build a Real-Time NYC Taxi Dashboard in Microsoft Fabric
The DP-700 capstone: a real-time dashboard with KQL tiles, the measures a report needs, and three report pages for three business questions.

Seventeen labs built a platform. But a platform is not a deliverable: nobody outside the data team ever opens a lakehouse. What the business sees is at the very end, a report and a dashboard. Module 18 of the DP-700 course builds both.
Part 1: A real-time dashboard on the eventhouse
Create a real-time dashboard named Taxi live in Taxi Dev. A real-time dashboard is made of tiles, and every tile is a KQL query with a visual.
The question of the first new tile: which zones are busiest right now? From trips_live, the last few minutes, count trips by zone, top ten.
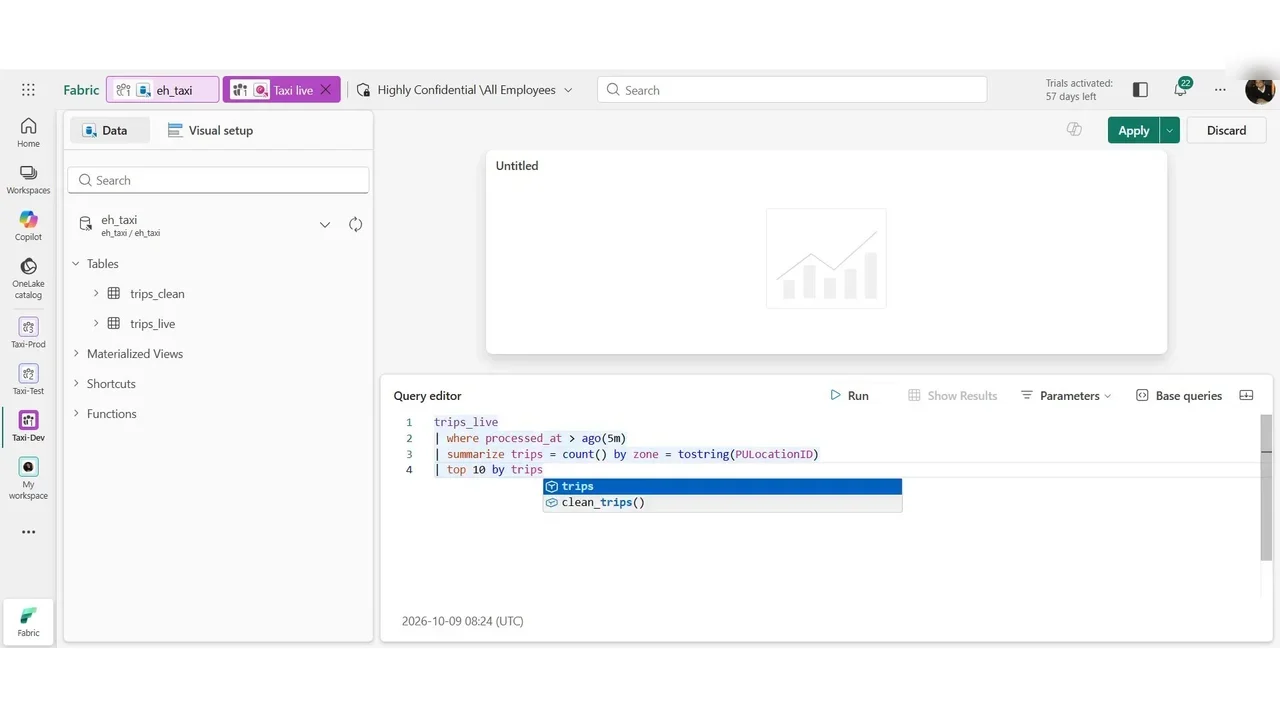
Save, then Refresh: the bars move, because trips keep arriving. Under settings, a dashboard can refresh itself on a schedule.
Part 2: The measures the report needs
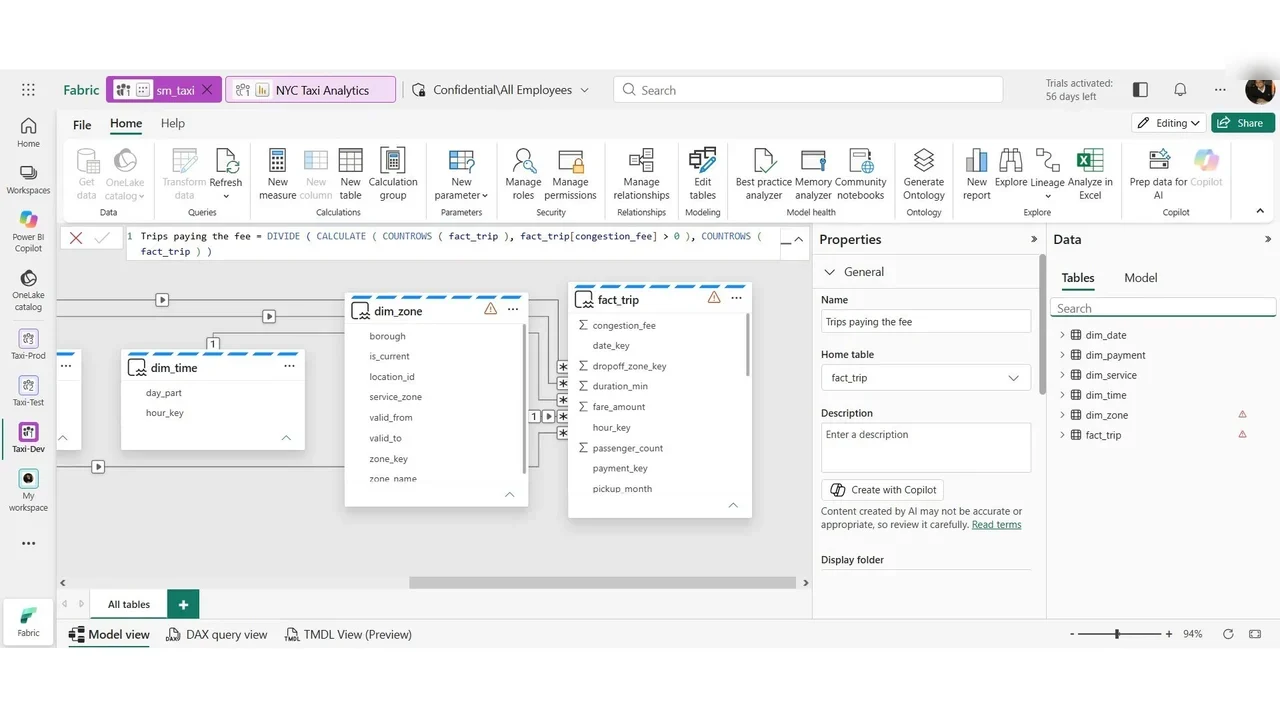
In the semantic model, the report needs measures beyond simple sums, for example the share of trips paying the congestion fee: DIVIDE(CALCULATE(COUNTROWS(fact_trip), fact_trip[congestion_fee] > 0), COUNTROWS(fact_trip)).
Part 3: Three pages, three questions
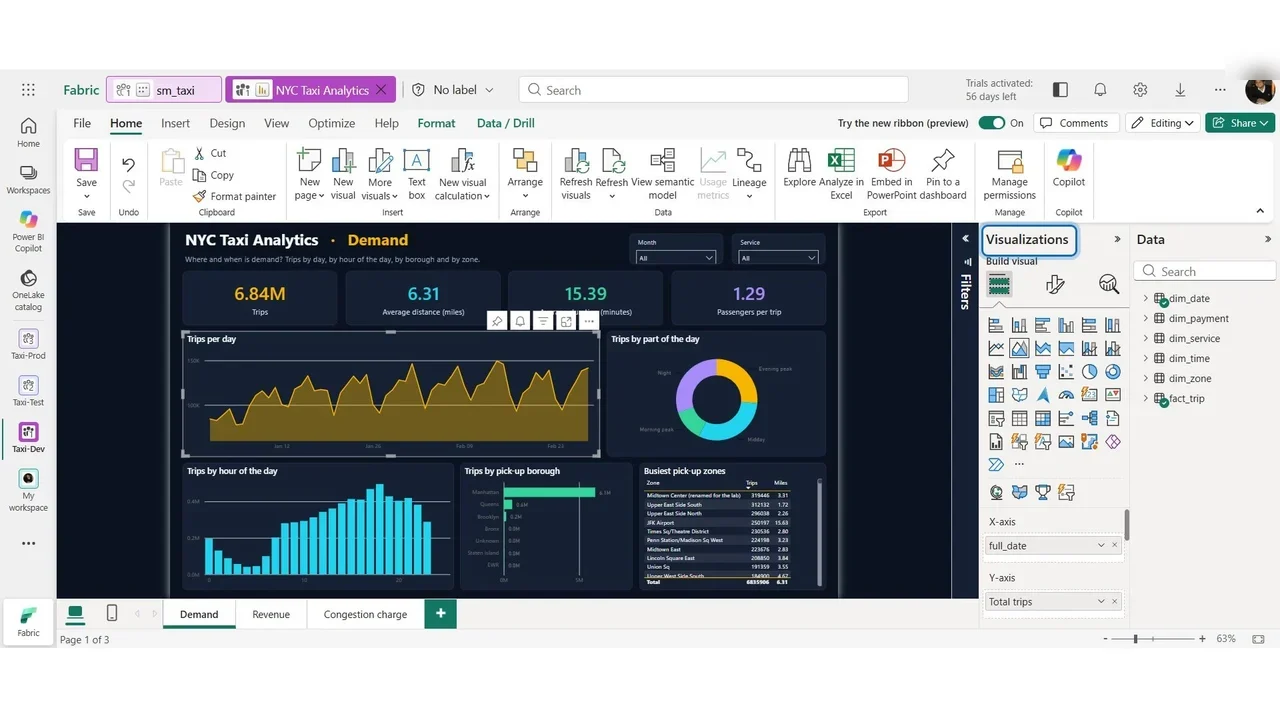
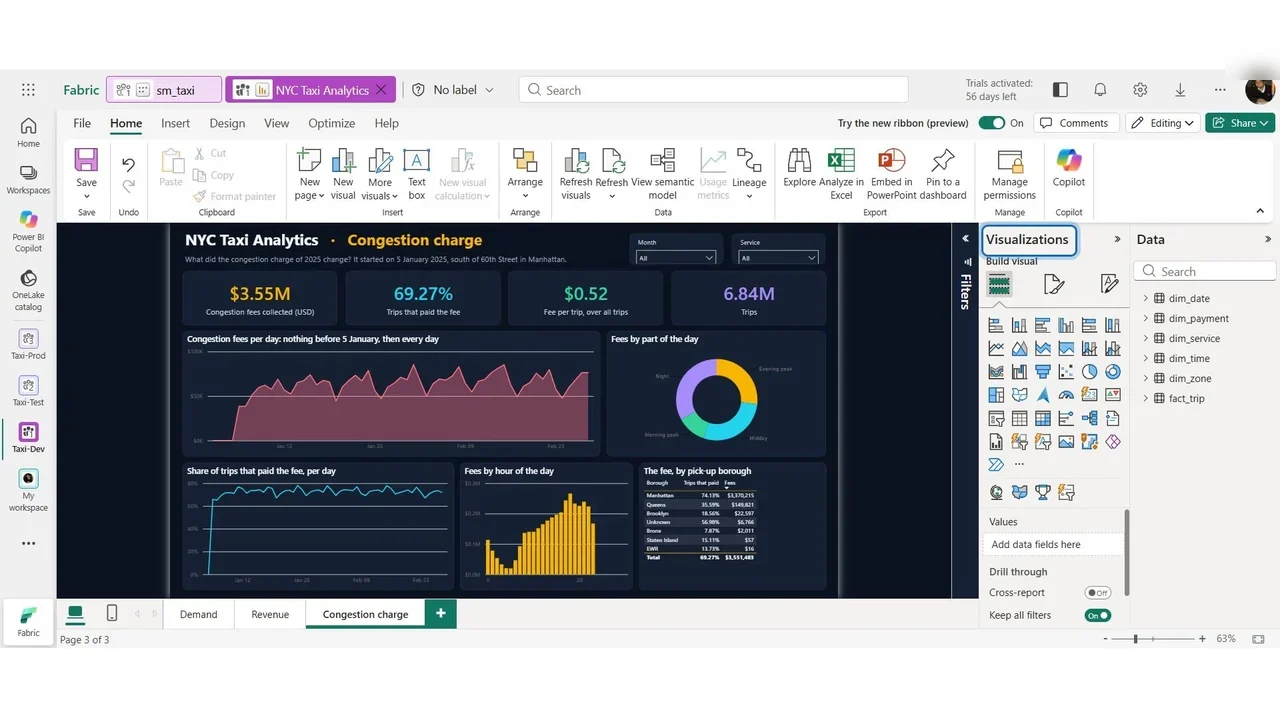
Demand: where and when? Trips per day, by hour and by borough.
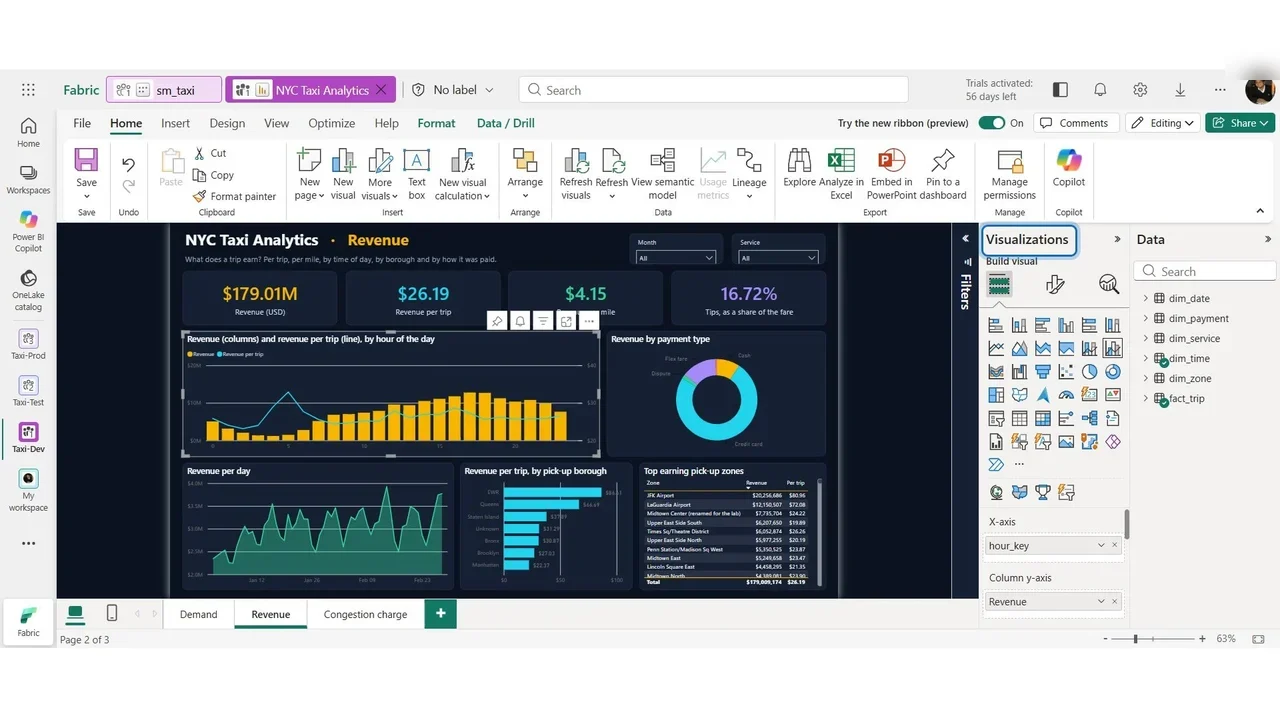
Revenue: what does a trip earn? Per trip, per mile, by time of day, and by payment type.
Congestion charge: what did the 2025 charge change? Fee per day, the share of trips that paid it, and where.
How you know it worked
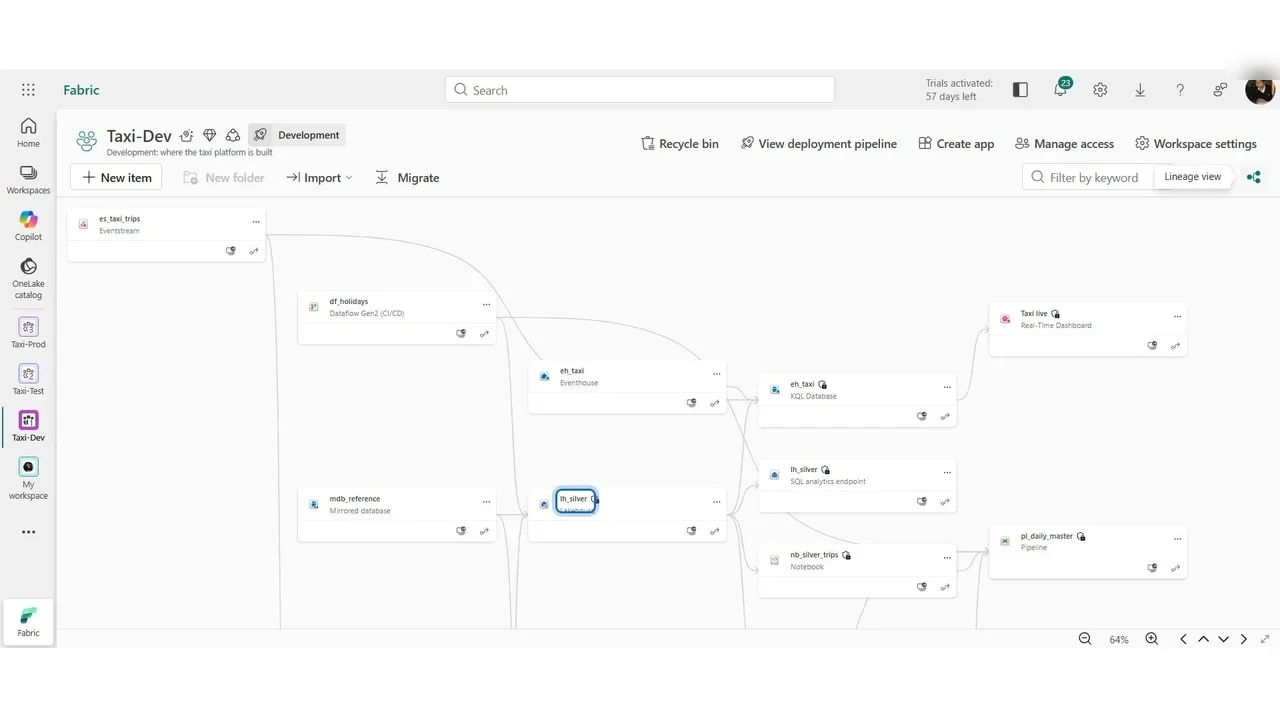
The workspace lineage shows the whole platform: landing, bronze, silver and gold, the notebooks and pipelines between them, the semantic model, the report and the real-time path.
Two front ends, two questions
- The report, on the semantic model and the warehouse: months of history, as fresh as the last load.
- The real-time dashboard, on the eventhouse: what is happening in the last few minutes.
Knowing which one a question needs is exactly the kind of choice the exam tests.
Do it yourself
- The full DP-700 courseEvery Part, free on YouTube, in order
- Hands-on lab guideThe exact steps, what it costs, how to clean up
- Practice simulationRehearse every click in your browser; the first lab is free
- Mock examFree 10-question sample, then the full timed mock scored by domain
Lab guides, practice and full mock exams come with a subscription. See the plans