

DP-600 Course guide
DP-600 Exam Guide: From Raw Data to a Secured Fabric Model
What the DP-600 Fabric Analytics Engineer exam covers and a hands-on plan: raw data to a secured semantic model and a deployment pipeline.

The data usually exists. What is missing is everything between the data and a number people trust. Building that is the job of the analytics engineer, and it is what the DP-600 exam, Fabric Analytics Engineer Associate, measures.
The problem the course solves
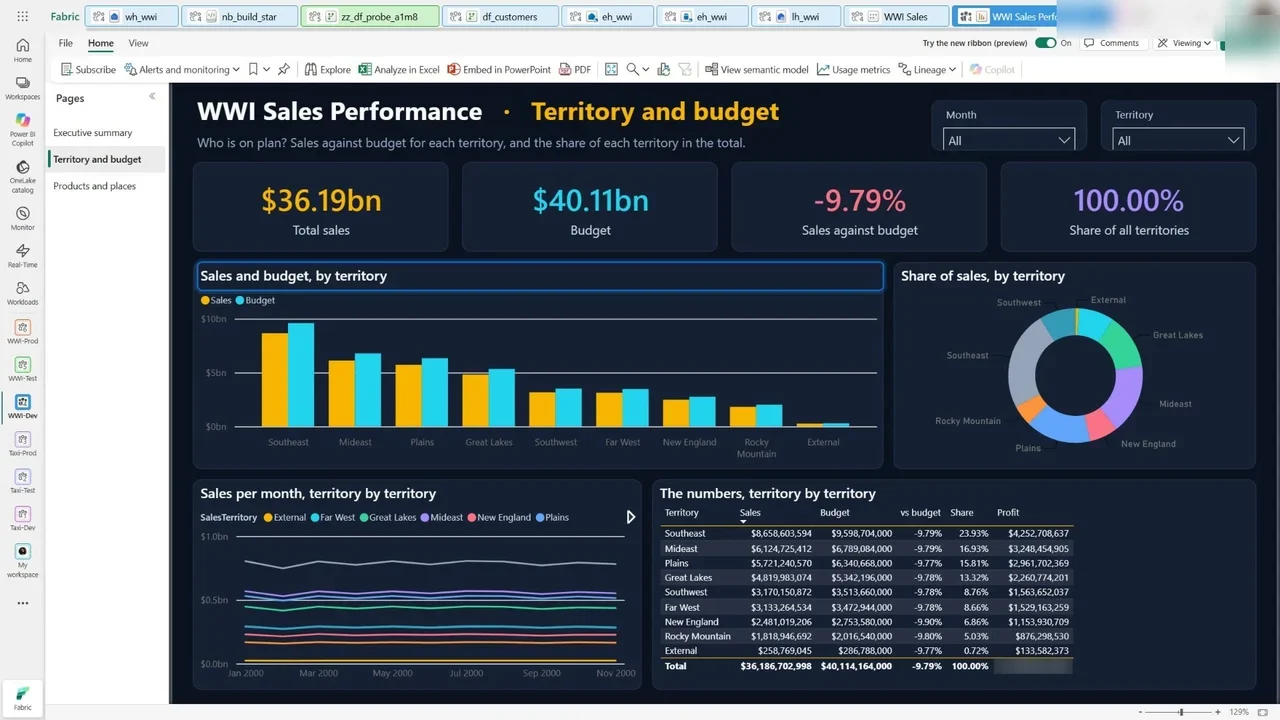
Wide World Importers is a wholesale company selling to shops across the United States: thousands of invoices, hundreds of products, ten sales territories. The sales director asks who is on plan? The finance director asks what do we earn? And each manager may see only their own territory.
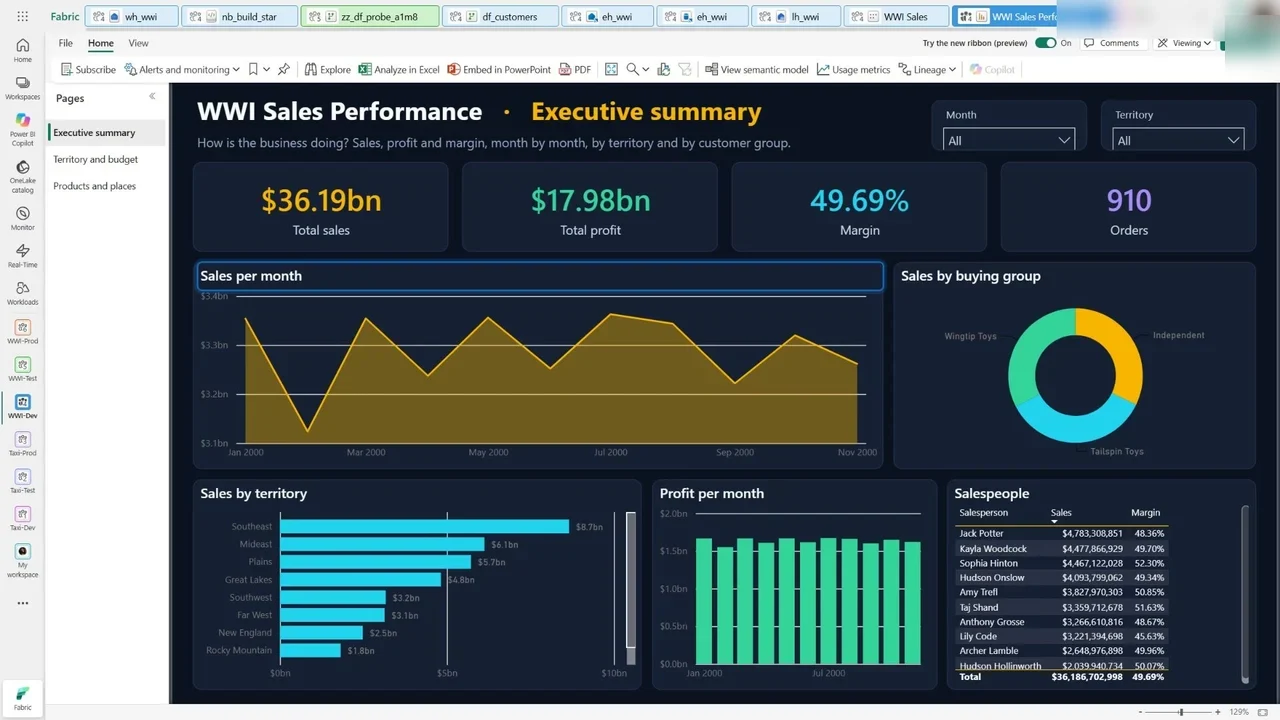
The finished answer is a three-page report in Microsoft Fabric, WWI Sales Performance.
Five layers you build
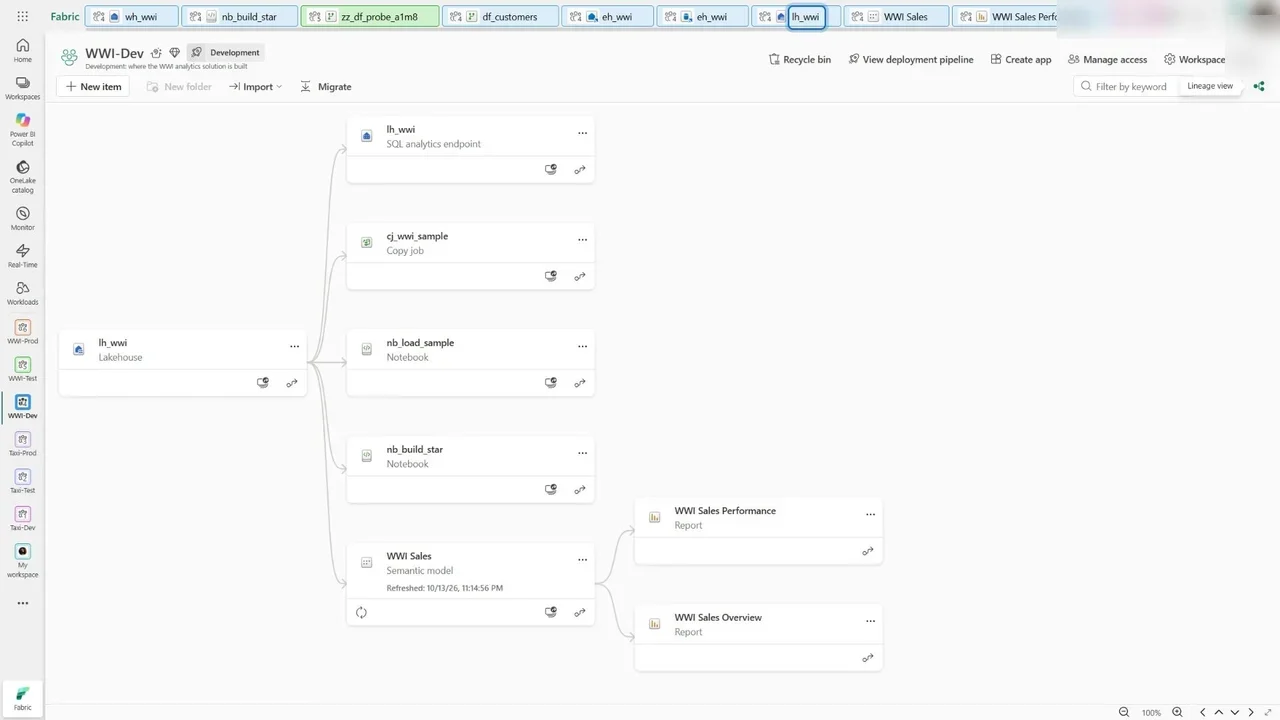
- Get the data, with a copy job and a dataflow.
- Store it: a lakehouse, a warehouse, and an eventhouse for live orders.
- Shape it into a star schema, once with T-SQL and once with a notebook.
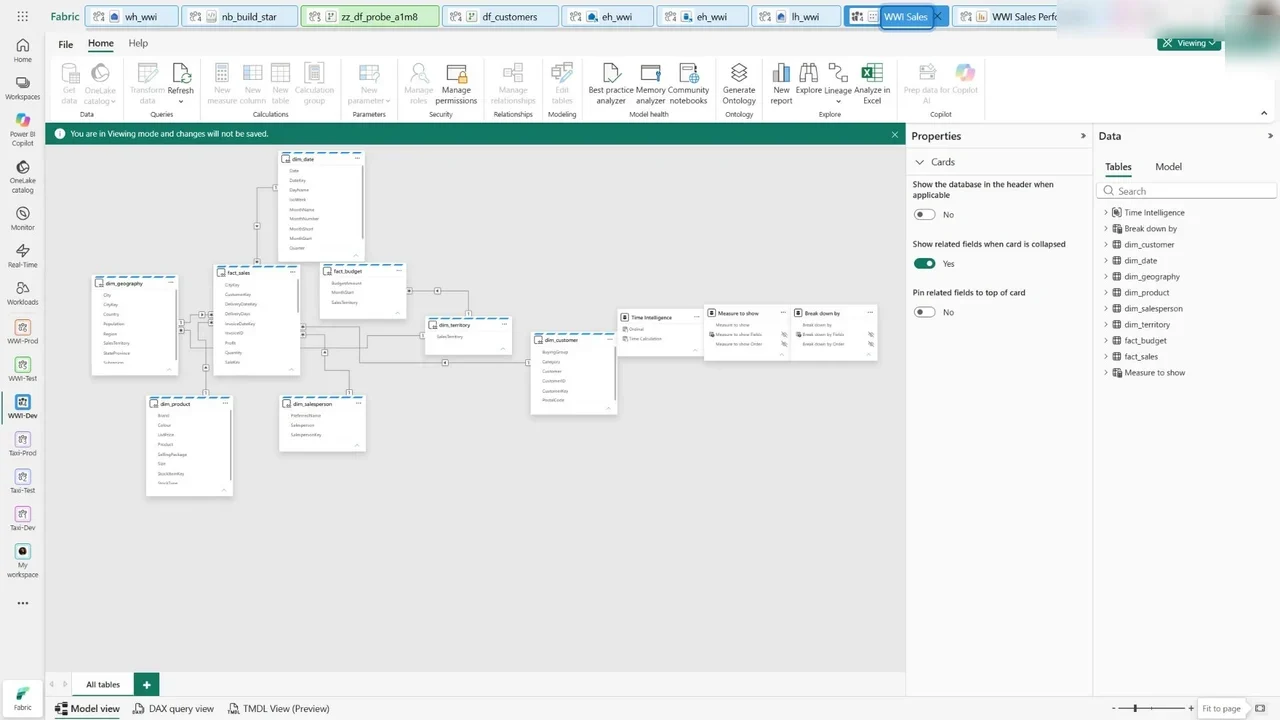
- The semantic model, in Direct Lake mode, with measures in DAX.
- The report, secured with roles and shipped through a deployment pipeline.
The three exam domains
- Maintain a data analytics solution: security, governance and the life cycle.
- Prepare data: get it, transform it, and query it. Almost half of the exam, and the first half of the course.
- Implement and manage semantic models: the model, DAX and performance.
Check the official study guide for the current weights; one project teaches depth, and the exam also tests breadth.
How every module works
Every module has two parts: a short theory video on slides (what the thing is, when to choose it, and one exam question), then the lab, where every step is performed for real in a live tenant.
What you need
A Microsoft 365 tenant that is not production, with an account that is a Fabric administrator; the free Fabric trial (60 days, every workload), started in Module 0; and a browser. Power BI Desktop is mentioned where the exam expects it, and never required.
The full course is free on YouTube
The overview above is the first of 34 videos. Start with Module 0, theory first and then the lab, and keep the same tenant for the whole course.
Do it yourself
- The full DP-600 courseEvery Part, free on YouTube, in order
- Hands-on lab guideThe exact steps, what it costs, how to clean up
- Practice simulationRehearse every click in your browser; the first lab is free
- Mock examFree 10-question sample, then the full timed mock scored by domain
Lab guides, practice and full mock exams come with a subscription. See the plans