

DP-600 Step by step · Module 8
Direct Lake Semantic Models: The Star Schema Done Right
Import, DirectQuery or Direct Lake? Create a Fabric semantic model in Direct Lake mode over a lakehouse star schema with correct relationships.

The lakehouse holds a clean star: six dimensions and two fact tables. But a report does not read tables. It reads a semantic model: the tables, the relationships between them, and the calculations. In Module 8 of the DP-600 course we build one for Wide World Importers.
The first decision: storage mode
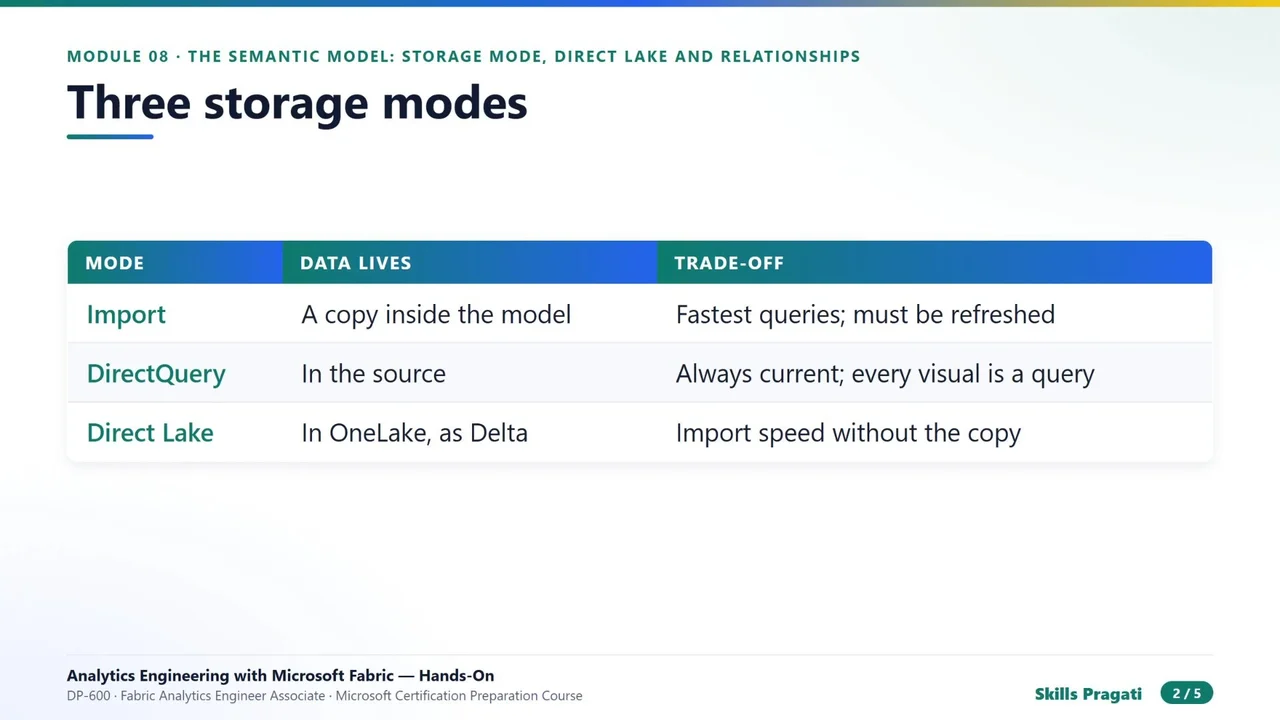
- Import copies the data into the model. Queries are the fastest, and the copy must be refreshed.
- DirectQuery copies nothing: every visual sends a query to the source. Always current, and slower.
- Direct Lake reads the Delta tables in OneLake directly: the speed of import, without the copy.
When the data is already in a Fabric lakehouse or warehouse, start with Direct Lake.
Step 1: Create the model
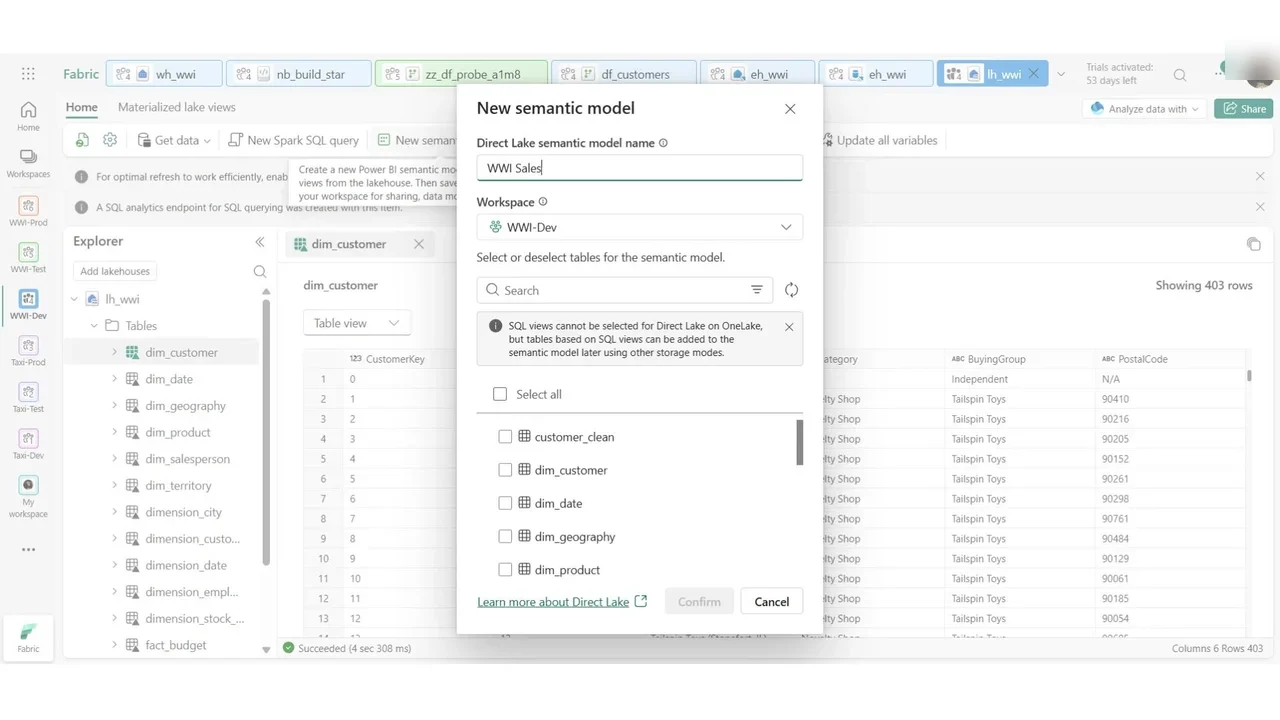
From the lakehouse, create a new semantic model named WWI Sales, in the WWI-Dev workspace.
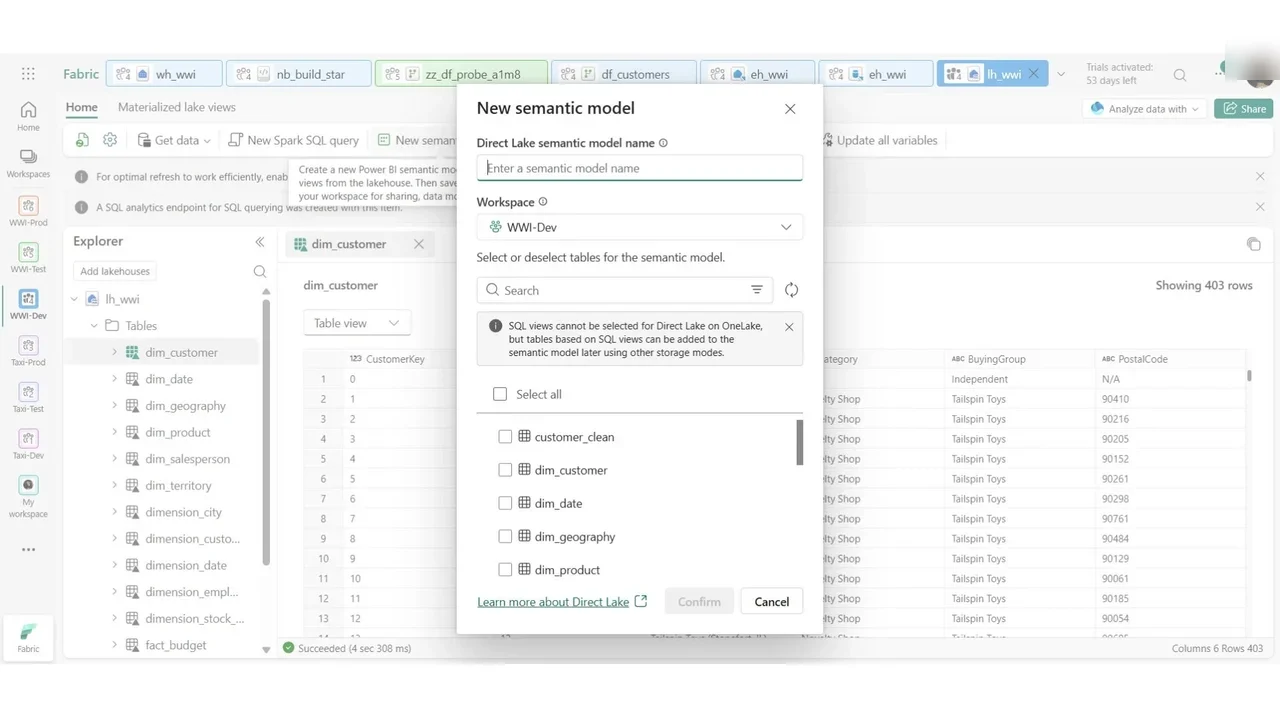
Step 2: Pick exactly the tables you need
The lakehouse also holds the raw tables from Lab 1, and we do not want those. Tick exactly eight: the six dimensions (customer, date, geography, product, salesperson and territory) and the two facts.
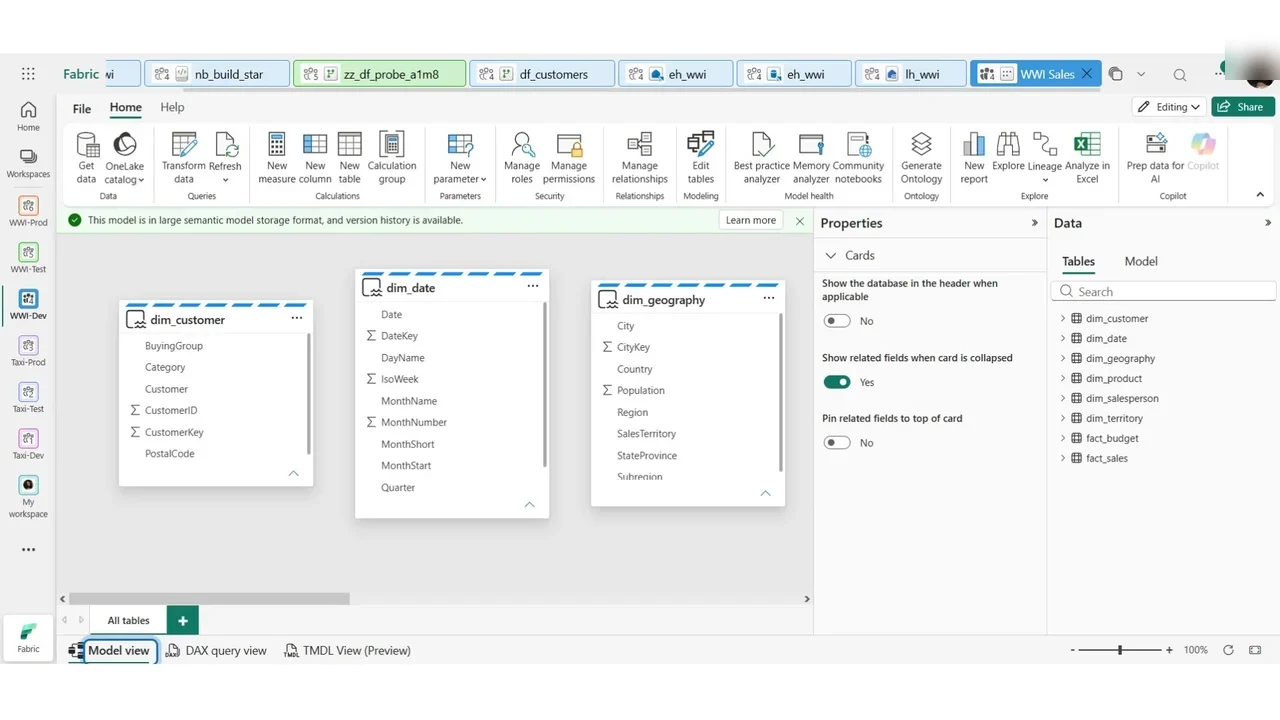
The model opens in model view: eight tables as cards, and no lines between them yet. Nothing was copied; the model points at the Delta tables of the lakehouse.
Step 3: Build the star
A relationship connects a key of the fact to the same key of a dimension: many sales, one customer. A filter travels along it, from the dimension to the fact.
The budget is kept per territory and per month, not per city and per day, so it joins the dimensions at a different grain. And one relationship is easy to forget: dim geography → dim territory (many cities, one territory). With it, a slicer on the territory filters the cities, the cities filter the sales, and the budget follows.
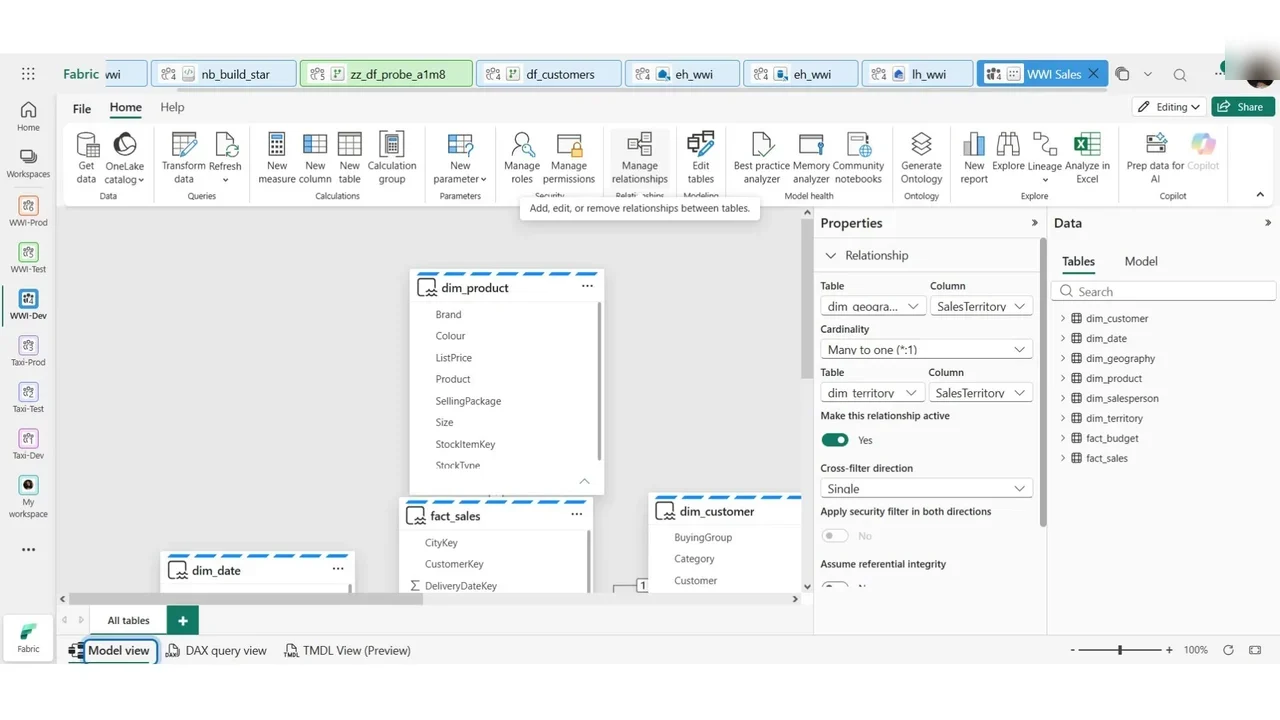
Exam warning: in Direct Lake, the editor does not check your keys for you. A wrong relationship gives wrong totals, not an error.
How you know it worked
The relationships list shows every relationship with its two columns and cardinality, all active, and the diagram shows the fact table in the middle of its dimensions, with the budget joined through the territory and the date.
Rules to remember
- Between two tables only one relationship is active. A second one, such as the delivery date, stays inactive until a measure asks for it.
- Many-to-many and both-direction filters are exceptions: they cost performance and can give surprising totals. Use them only with a reason.
Do it yourself
- The full DP-600 courseEvery Part, free on YouTube, in order
- Hands-on lab guideThe exact steps, what it costs, how to clean up
- Practice simulationRehearse every click in your browser; the first lab is free
- Mock examFree 10-question sample, then the full timed mock scored by domain
Lab guides, practice and full mock exams come with a subscription. See the plans