

Advanced Excel Masterclass in Hindi Course guide
Advanced Excel in Hindi: 20 Labs From Raw Data to BI
Twenty hands-on labs, one workbook: from a messy export to a full BI dashboard in Excel for the web. The videos are in Hindi; this guide is in English.

Note: the course videos are in Hindi (Hinglish, with English Excel terms on screen). This guide summarises the course in English.
Most Excel courses teach functions one at a time on toy data. This one uses twenty hands-on labs on one workbook for one company, Pragati Industry, a fictional Indian outdoor-products company with invented but realistic data: four regions, eight sales reps, sixty customers, sixteen products and two years of orders, every amount in rupees. The workbook grows lab by lab, from a messy system export to a complete BI dashboard.
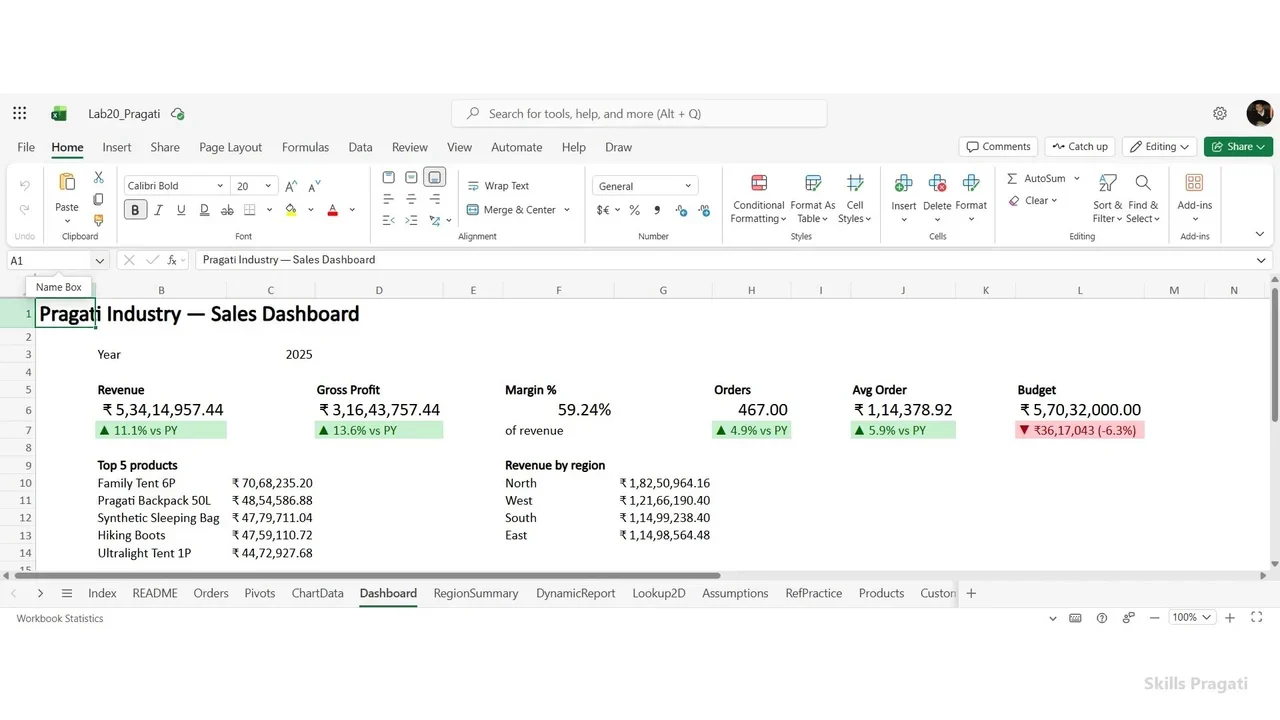
What the workbook holds
- Orders: the main table, nearly a thousand orders.
- Products, Customers and SalesReps: one row each, for lookups and grouping.
- Raw Extract: a deliberately messy export, cleaned in the data-cleaning labs.
- Budget, HR and Inventory: targets, employees and stock for the reporting projects.
The six parts
- Foundations and formulas: tables, names and references; cleaning; IF, IFS, SWITCH and LET; XLOOKUP and INDEX/MATCH; text, date and SUMIFS functions; dynamic arrays.
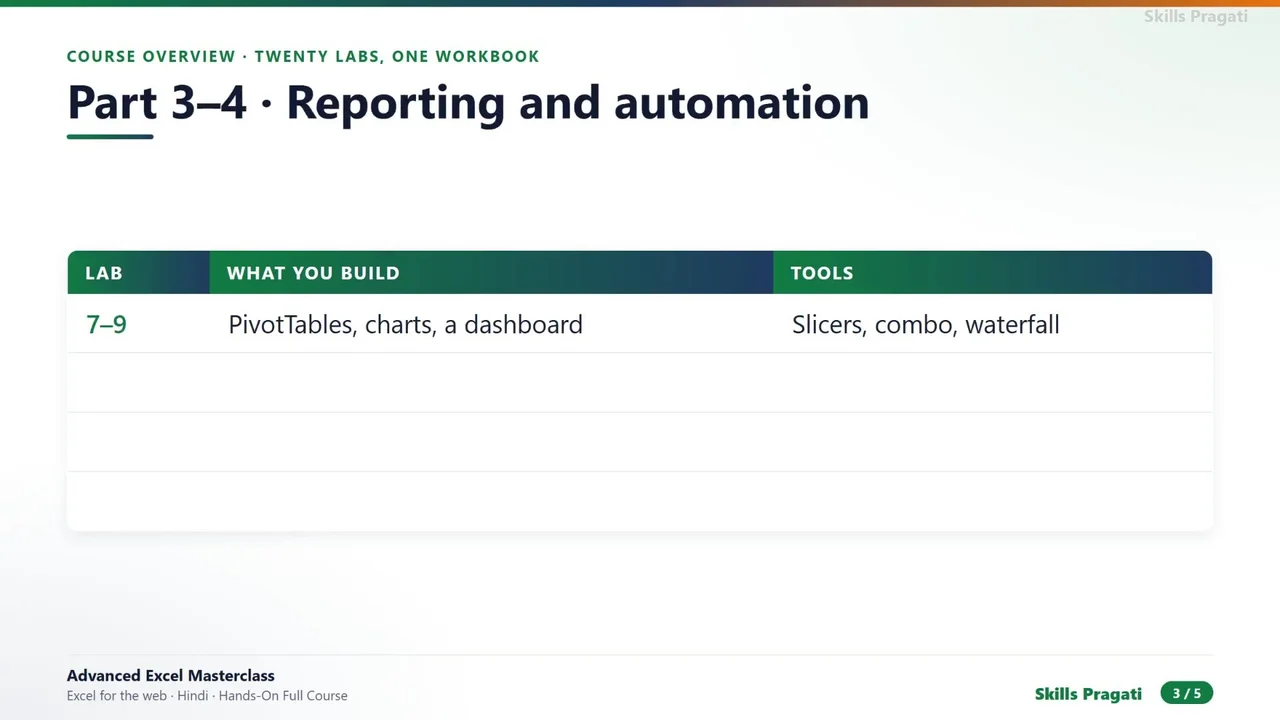
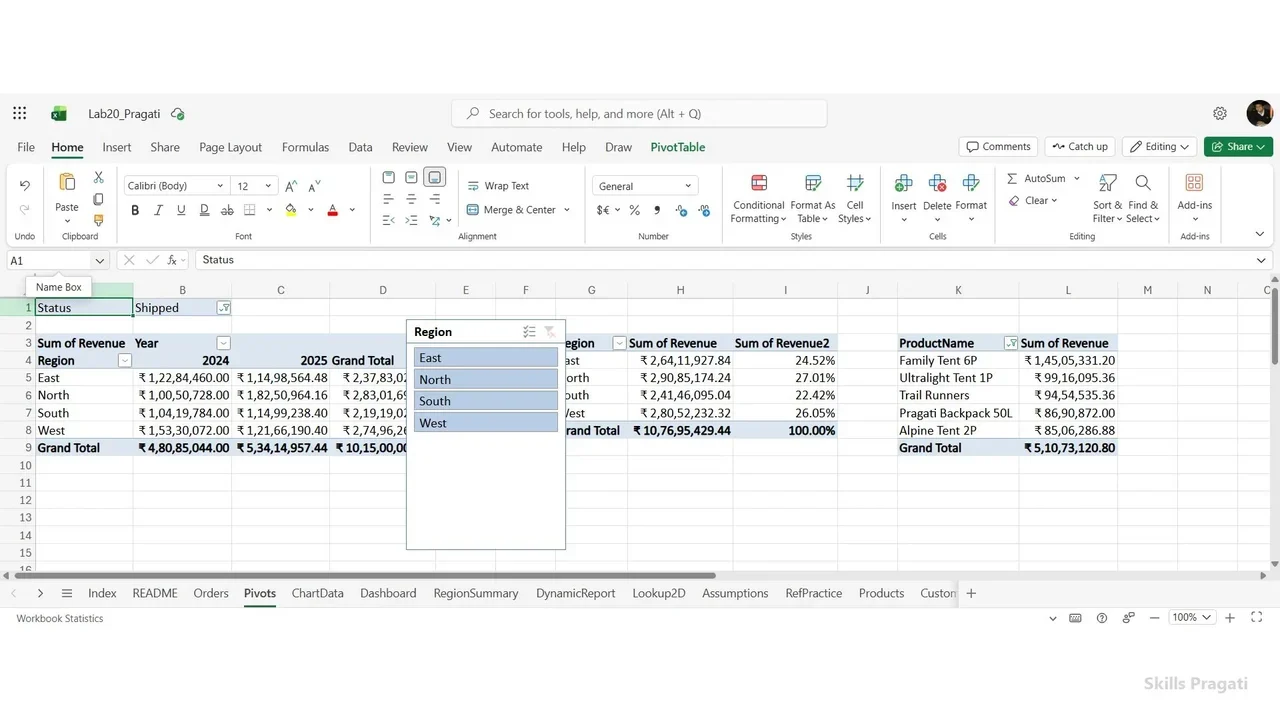
- Reporting and automation: advanced PivotTables, advanced charts, dashboard design, Power Query and M.
- Modelling and analytics: Power Pivot and the data model, DAX measures, macros, VBA and Office Scripts, what-if analysis, statistics and forecasting.
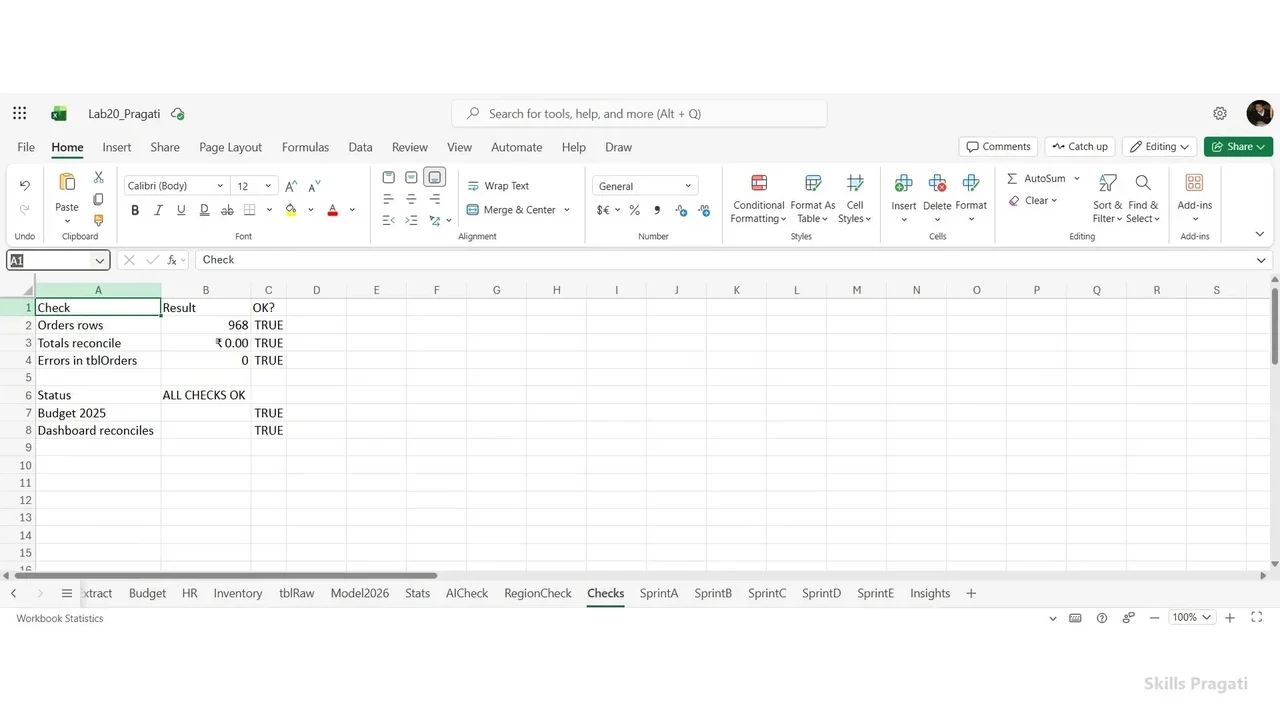
- Professional practice: AI-assisted Excel with verification, auditing and a Checks sheet, five business reporting sprints, and the capstone.
What you need
A browser and Excel for the web (free with a Microsoft account). A few labs mention desktop-only features where relevant. The lab guide and practice files come with the course.
The full course is free on YouTube
The overview above is the first of 22 videos, in Hindi. Start with Lab 0 and keep the same workbook throughout.
Do it yourself
- The full Advanced Excel Masterclass in Hindi courseEvery Part, free on YouTube, in order
- Hands-on lab guideThe exact steps, what it costs, how to clean up
- Practice simulationRehearse every click in your browser; the first lab is free
- Mock examFree 10-question sample, then the full timed mock scored by domain
Lab guides, practice and full mock exams come with a subscription. See the plans